Our first Answerathon was a success! Congratulations to Alex for winning! You've absolutely earned your bragging rights.
I am truly awed by the response this competition has gotten. It ran for 33 days (treated as 29 for competition purposes), which, frankly, was 31 days longer than I expected it to go. A whopping ONE HUNDRED EIGHTY-FOUR answers have been posted as a result of this Answerathon.
Monica put it best: “Answer unanswered questions, increase torah, inspire others -- all good outcomes.” We got people hunting for questions rather than relying on the home page, and overall, lots of good content coming into the site as a result. We even got a revered moderator caught on charges of plagiarism.
How did the competition do?
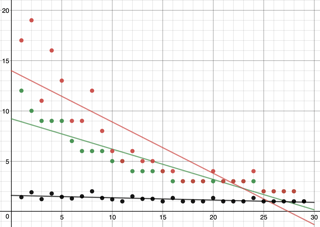
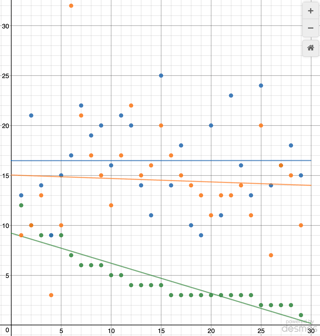
When you all are done celebrating down in the comments and answers, I've got some data for you to see. You can examine and manipulate the full graphs for yourself here.
The x-axis is the current "day" of the competition (remember that every multiple of 6 is actually two days, covering both Friday and Shabbos).
The green plot is the number of users - as you’d expect, steadily decreasing over the course of the competition. The red plot is the number of eligible answers posted each day, and the black plot is the average number of answers per participant. (“Eligible answers” is defined as any answer, regardless of its score, that was posted by a user still in the competition on a previously unanswered question. It’s this criterion that lead to the 184 figure I cited above.)
The interesting thing is the black line: technically it is decreasing, but it’s fairly stable, averaging about 1.5 answers per user. This number never got higher than 2 answers per user. Overall, then, a significant portion of users only posted one answer per day (most of the offenders happened to be mods, so I’ll cut them some slack).
How did the competition impact other site activity?
The orange plot is the number of questions (including ones since closed), and the blue plot is the number of ineligible answers. Again, no surprises: their respective data are all over the chart, with the line of best fit…not being such a good fit, but still fairly horizontal. The competition, surprisingly, didn’t affect other site activity significantly.
If I may draw your attention to days 6 and 7…
Days 6 and 7, the first Friday-Shabbos-Sunday of the competition, were a very interesting weekend. 1/3 of the participants (read: 3) dropped out by the end of the weekend, the the number of eligible answers posted was a local minimum (9 - the lowest yet), and the total reputation was also a local minimum (190 and 150, the lowest scores until day 11’s 85 and day 13’s 80).
In contrast, ineligible answers were at a local maximum (22 on day 7). New questions at a global maximum, with 32 on day 6.
What to make of this? I’m not sure. Maybe that people post more new content on the weekend, and have more time to focus on older questions during the week? There tend to be local maxima in all non-contest related activity on all weekends, particularly Fridays, surprisingly.
And now for Round Two!
Please take all suggestions for round two over here.


